Monitoring Agents
Marvel Enterprise Monitoring Agents are installed where you have resources you want to monitor. The agents and the operating system, subsystem, or computer that they are running on are referred to as managed systems. The Navigator Physical view shows the types of agents installed and running on each managed system.
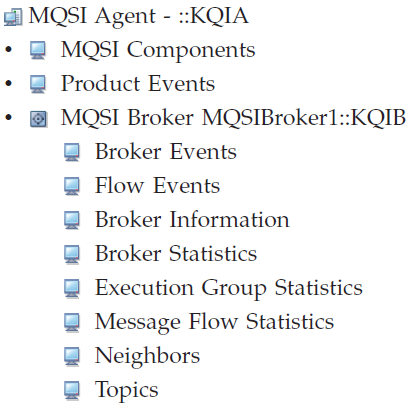
Some agents also have subagents. In such instances, the agent is the managing agent. For example, the WebSphere® MQ Integrator Series agent has MQSI Broker subagents. Subagents are displayed in the Navigator below the managing agent and its attribute groups.
The agent gathers the current values of the attributes (elements) specified in a view. Gathered attribute values can also be tested against a threshold and display an event indicator when conditions exceed the threshold. Some agents have fewer than 100 attributes and many have several hundred. These attribute values are displayed in the table and chart views of workspaces at the system, agent, and attribute group level of the Navigator Physical view. When an attribute value (or range of values) is specified in a situation, as a table threshold, or as a chart or table view filter, Marvel Enterprise Portal compares the current value with the value specified and does the following:
- If the comparison in the situation is met, then the situation is true, and the event indicators are displayed in the Navigator.
- If the compared value exceeds the threshold specified for the table, the cell is highlighted in red, yellow, or blue.
- If the compared value meets the filter condition, it is included in the chart or table display.